

Job History
You can use DataZen Manager to inspect the history of a job, including the log output of each execution and key performance metrics.
You can inspect job history in the following ways:
- From the History... icon after selecting a job
- From the History... context menu of the select job
Job History
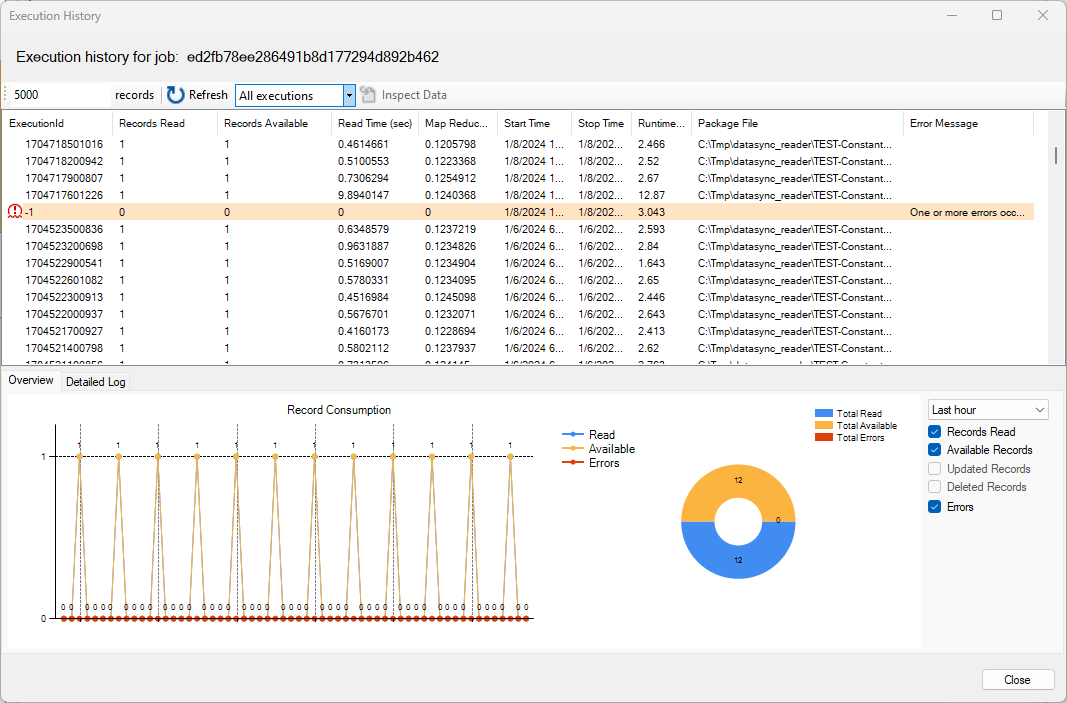
The center of the screen shows you the most recent successful job executions along with statistical information. Depending on the job type, some of the fields below may not be displayed.
- Execution Id: a unix-style timestamp when the job started
- Records Read: number of records read from the source system, if the job is a reader
- Records Available:: number of records available after the change data capture map-reduce operation (if applicable), if the job is a reader
- Records Updated: number of records updated in the target system, if the job is a writer or a Direct Job
- Records Deleted: number of records deleted in the target system (if applicable), if the job is a writer or a Direct Job
- Read + Write Time: total time spend reading and writing, if the job is a Direct Job
- Read Time: total time spend reading, if the job is a Job Reader
- Write Time: total time spend writing, if the job is a Job Writer
- Map-Reduce Time: total time spend performing the change capture map-reduce operation (if applicable), if the job is a Job Reader or a Direct Job
- Start Time: the datetime when the job started
- End Time: the datetime when the job completed
- Runtime: the total duration of the job
- Package File: the location of the change log (if applicable)
- Error Message: the last error message (if applicable)
Filters
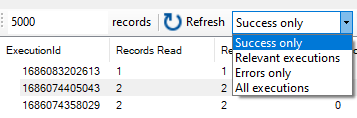
You can change the filters to view all job executions, relevant executions (successful with records available and errors), or only the executions that failed. You can also modify the number of records returned (a positive number must be specified).
Inspect Data
When available after clicking on a job execution, the Inspect Data button allows you to inspect the change log that was generated by this execution.
Overview Tab
The Overview tab displays a graphical representation of the job history and can show record counts within the last hour (default), last 24 hours, last 7 days, last 30 days, or last 90 days.
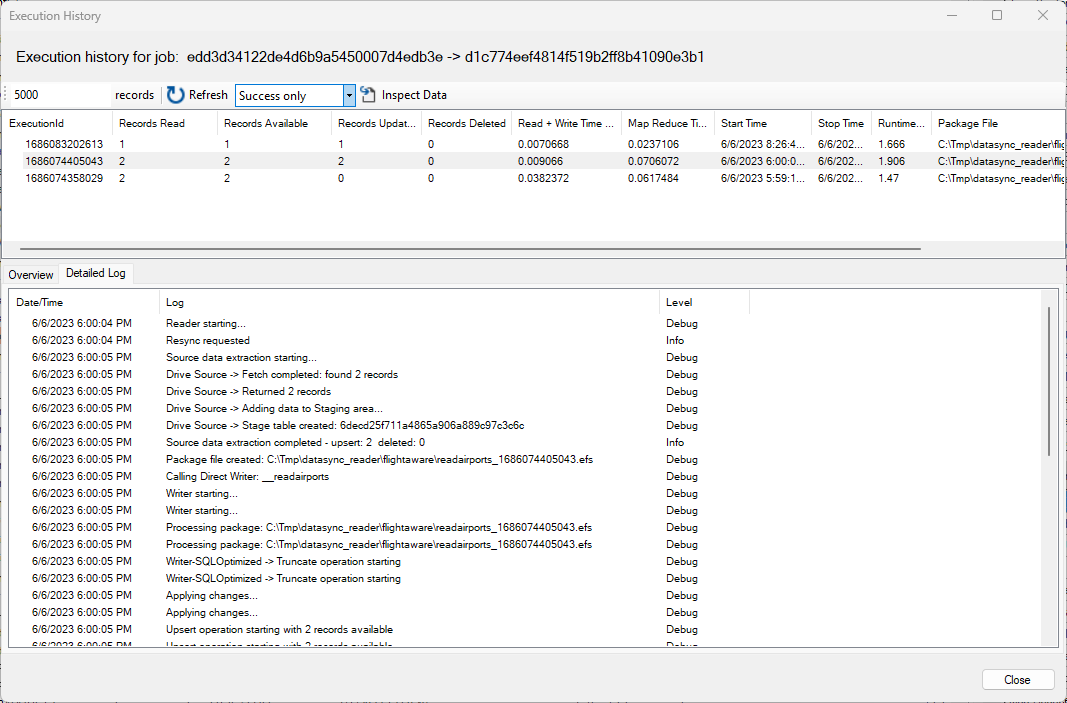
Detailed Log
The Detailed Log tab shows the job output for the selected execution. This output can be helpful to troubleshoot issues if multiple errors are logged. When inspecting a Direct Job, this output shows the log of both the Reader and Writer operation. However, if a trigger has been defined on the job, this output will not show the log of the jobs that have been triggered.